File:Keyfigures chart 1.png
Jump to navigation
Jump to search


Size of this preview: 800 × 457 pixels. Other resolution: 1,852 × 1,058 pixels.
Original file (1,852 × 1,058 pixels, file size: 132 KB, MIME type: image/png)
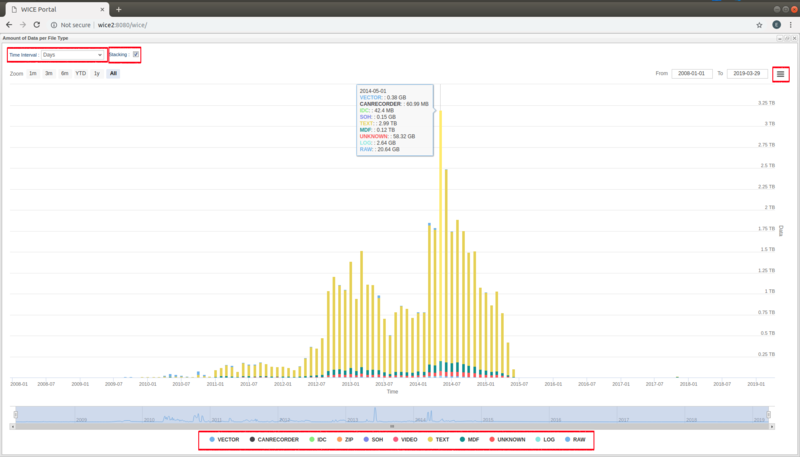
Key Figures chart pointing out three basic functionalities. In the upper left corner there is a drop down menu for selecting the time sampling interval. In the upper right corner you find a menu used for export of the chart image and data. Finally, below the chart there is a clickable legend which can be used to select and deselect the available data series.
File history
Click on a date/time to view the file as it appeared at that time.
| Date/Time | Thumbnail | Dimensions | User | Comment | |
|---|---|---|---|---|---|
| current | 15:04, 29 March 2019 |  | 1,852 × 1,058 (132 KB) | Erika (talk | contribs) | |
| 09:18, 19 December 2018 |  | 1,854 × 1,056 (115 KB) | Erika (talk | contribs) |
You cannot overwrite this file.
File usage
The following page uses this file: