Difference between revisions of "Tasks Tab"
| Line 79: | Line 79: | ||
"Convert to text" will convert and download selected MDF file(s) to your computer. When doing this you will get a pop-up with the ability to add a description to your download. This is only availible for MDF files and this button can therefore only be found on assignments with MDF files. | "Convert to text" will convert and download selected MDF file(s) to your computer. When doing this you will get a pop-up with the ability to add a description to your download. This is only availible for MDF files and this button can therefore only be found on assignments with MDF files. | ||
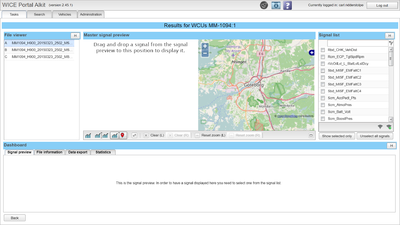
[[File:Preview data.png|thumb|400x400px|Figure x: The preview data window.]] | |||
"Preview data" will give you a data preview window where you can preview the selected file(s) data. "Preview data" has many functions and tools that will be explained one by one below refering to figure x which is a preview data window. One of the main functions is to view signals as grafs and se their route. To do so you need to select signal(s) from the file(s) you want. You select signals to the right where you see the list of signals. That list of signals is specifik for the selected file. You can change which file you want signals from in the box "file viewer" on the left. Note that the files to the left are the files you had selected when clicking "Preview data". The selected signals can then be seen in the bottom under the tab "Signal preview" where you will see a quick preview of how their graph looks. You can save the selected signals by pressing the Wi-Fi symbol with a plus on it. This function work much like the [[The Portal User View#binoculars|binoculars]] except that you can not set a standard view. Note that its not the signal that is saved but the signal name so when loading saved signals it will search for signal names that are exactly identical and not signals that measure the same thing. By dragging the previewed signal(s) to the "Master signal preview" in the middle you can see a more extended version of the signal graph. If you want to have a bigger "master signal preview" you can press its fullscreen button on the left or you can manually hide other areas you do not want to see by pressing the "H" on them. To go show the areas again you can press the "S" (where "H" used to be). "Master signal preview" also has 3 preview modes that you can select in the bottom left corner of the "Master signal preview" area. The preselected view is with one graph on the left and a map on the right where the signals' routes will be shown. You can also select so that instead of a map it will show a second plot or so it only shows one plot. There are always two plots even though you always can not see two plots. This means you can always use the button "Switch" to make the plots switch places. When there is two plots shown they just switch positions but when there is only one plot shown the shown plot (the left one) will switch with the hidden plot (the right one). To zoom in on grafs you drag between two points(not necessarily data points) on the graf and it will zoom in between those two points.To zoom out you press "Reset zoom" for L or R depening on which plot you want to zoom out. Notice that "Zoom out (R)" is only clickable when you show two plots and that is because even if there always are two plots you can only zoom out and clear shown plots. | "Preview data" will give you a data preview window where you can preview the selected file(s) data. "Preview data" has many functions and tools that will be explained one by one below refering to figure x which is a preview data window. One of the main functions is to view signals as grafs and se their route. To do so you need to select signal(s) from the file(s) you want. You select signals to the right where you see the list of signals. That list of signals is specifik for the selected file. You can change which file you want signals from in the box "file viewer" on the left. Note that the files to the left are the files you had selected when clicking "Preview data". The selected signals can then be seen in the bottom under the tab "Signal preview" where you will see a quick preview of how their graph looks. You can save the selected signals by pressing the Wi-Fi symbol with a plus on it. This function work much like the [[The Portal User View#binoculars|binoculars]] except that you can not set a standard view. Note that its not the signal that is saved but the signal name so when loading saved signals it will search for signal names that are exactly identical and not signals that measure the same thing. By dragging the previewed signal(s) to the "Master signal preview" in the middle you can see a more extended version of the signal graph. If you want to have a bigger "master signal preview" you can press its fullscreen button on the left or you can manually hide other areas you do not want to see by pressing the "H" on them. To go show the areas again you can press the "S" (where "H" used to be). "Master signal preview" also has 3 preview modes that you can select in the bottom left corner of the "Master signal preview" area. The preselected view is with one graph on the left and a map on the right where the signals' routes will be shown. You can also select so that instead of a map it will show a second plot or so it only shows one plot. There are always two plots even though you always can not see two plots. This means you can always use the button "Switch" to make the plots switch places. When there is two plots shown they just switch positions but when there is only one plot shown the shown plot (the left one) will switch with the hidden plot (the right one). To zoom in on grafs you drag between two points(not necessarily data points) on the graf and it will zoom in between those two points.To zoom out you press "Reset zoom" for L or R depening on which plot you want to zoom out. Notice that "Zoom out (R)" is only clickable when you show two plots and that is because even if there always are two plots you can only zoom out and clear shown plots. | ||
Revision as of 13:05, 13 July 2017
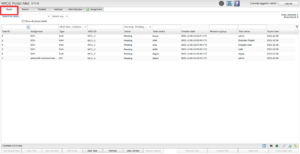
In the task tab you can search for tasks, view their assignment, see the log files, see the result files, manage assignments, and much more.
The Search Fields Section
The search field section consists of different columns where most have a field where you can insert search criteria to find assignments. As an example you have the label “Task ID:” which searches the field for task IDs matching your search criteria. When searching for tasks you can fill in one or more columns where the different search criteria will be treated with a logical AND between eachother.
In every collumn you can use regular expressions for your searches. To designate an "all" search you enter a period (".") for that particular field or leave it empty if another field is already filled. All searches are treated with the letters as wild-cards. An example is if you intend to search for tasks containing the word “bear” simply enter “bear” in the text field. Now, if there are tasks with the names “bear”, “polar bear”and “unbearable” all of these will match as they contain the word “bear” somewhere.
To search for a range of WCUs, assume the WCUs MM-810:1 – MM-823:1, you enter the query 81[0-9]|82[0-3]. This is a regular expression where the first expression, 81[0-9], means that we want our search to start with an '8' followed by a '1' and then any digit in range 0-9. The second part, 82[0-3], means an '8' followed by a '2' and then any digit in range 0-3. The two expressions are combined with a pipe characater ("|") which means logical OR. In other words we are looking for range 810-819 OR 820-823.
Note! If your WCU/resource group you are searching for has special characters (like '(' or '/') in its name you may need to escape these characters in order to get the desired result. Escape means putting a '\' before the special character. For example if you want to enter (and search for) the resource group name 'ABC(Alpha_Bravo_Charlie)' you need to write 'ABC\(Alpha\_Bravo\_Charlie\)'. Another example is when you want to list a WCU that contains "07-51" in its name. In this case you need to type "07\-51", otherwise the "-" character will make the searcher to search for a range of numbers.
For more info how to use regular expressions, see Regular Expressions
When you are filling in search criteria you can see in the top right corner how WICE says "Rows found:". That tell you how many assignments your search will find so you know if you need to narrow or broaden your search.
In the bottom right corner you can save and load saved search criterias by pressing one of the two binoculars that say "Save view" and "Apply a view".
If you are using an older version than 2.45.0 you have 4 bars with calanders to the right of them. This is a function to search assignments by date of creation and last update. This function has been removed in 2.45.0 and does not work like intended in 2.44.8.
The Result Section
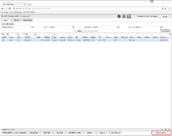
The assignments are fetched when you press the "Search" button in the tasks tab. Here we will go through the bottom part of task tab and the options for your previous search.
Assignment Options
You can right-click one or many assignments to get a window with a range of options described below:
- "Show task description" will show you the description of the task that the assignment you right-clicked on belongs to.
- "Go to Vehicles Panel" will take you to the vehicles tab. When you are in the vehicles tab the car(s) you selected will be shown in the vehicles tab.
- "Go to Search Panel" will take you to the search tab. When you are in the search tab the WCU(s) you selected will be selected in the search tab.
- "Get/Show assignment" will give you a small pop-up with some assignment information and a "Download assignment" button if a download is possible. If you choose to press "Download assignment" the assignment file will be downloaded to your computer in its original format.
- "Edit task" will give you the option to edit ownership and expiration date of the task. It will also show you the WCU(s) the task is running on.
- "Show car info" and "Show WCU info" will give you a pop-up showing you available info of the assignment car and WCU. Depending on which car/WCU you choose there will be different information available since cars/WCUs can lack information.
- "Show message" will show you the assignment's status message.
- "Plot route" will open a map in your current window. In that map you can see up to 100 of the cars registered positions during the last 24 hours or the last 100 registered positions. For more information about this read The Portal User View#Plot Route Dialog.
- "Event subscription" is an option where you choose to subscibe to a car, a WCU or an assignment. When hovering above "Event subscription" you will see three options, "Connect", "Assignment status" and "Result upload". With the option "Connect " you can subscribe to the selected car(s) or WCU(s) and get notified when their connection status changes. "Assignment status" and "Result upload" subscribes you to selected assignment(s) and gets you notified about status changes and when results are uploaded. You will se events when clicking on the bell symbol at the top which gets a red dot when theres new events from your subscriptions.
Column Options
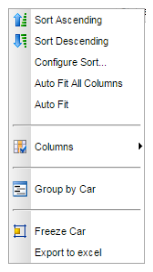
The result section have alot of ways to sort, view and handle the result with the columns. When right-clicking a column you will get a window with different options for the column.
- "Sort Ascending" and "Sort Descending" will sort the assignments in ascending or descending order after the column's attribute.
- "Configure Sort" where you can add more levels of sorting so that it sorts for more than one thing in different priority. For example can you sort after task ID ascending and then sort after WCU ID descending. When a column has a sorting prefrens the option "Clear Sort" will appear which clears your sorting prefrences for that column.
- "Columns" opens a window where you can select which columns you want to have shown and which you want to have hidden by checking their boxes or unchecking them. If you remove a column with a filled search criteria that criteria will still matter when you make a new search. Also when you make the new search the column will reappear.
- "Group by" group together the assignments that share the column's attribute value. When they are grouped there will be the option "Ungroup" that ungroups them.
- "Freeze" moves the column to the left corner and freezes it in position so it can be rearranged. If there is alraedy a frozen column till will move next to it as they go from left to right in chronological order. The "freeze" then becomes "Unfreeze" which revertes the freeze.
- "Export to excel" will export the columns and results into an excel file that will get downloaded.
- "Clear all fields" will clear all columns of their criteria.
- "Get help for this column" should take you here.
Get result files
When selecting a file you can view the result files by pressing "Get Result Files" if there are available result files. That will create a window where you can search, view and download result files. It is also possible to view result files from multiple assignments at the same time by selecting many assignments of the same type (Only possible for signalreader and MCD-Hub).
Searching result files
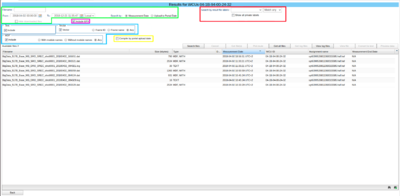
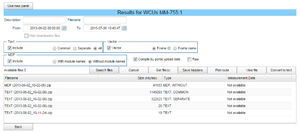
The window will look different depending on what kind of assignment you selected watching. The different windows all share alot of tools and have the same concept, to search and filter files. In figure x you can see how a MCD-Hub result window looks. This is a great example as this window contains all different tools while all the others can be seen as an MCD-Hub window that does not need and therefore lacks some of the tools. There are some tools that all have and just like when creating a task the common ones are at the top. Below is a description of all tools followed by which assignment window that has them:
General search functions
At the top there are two boxes, labeled "Description" and "Filename", where you can search for files based on their description and filename. The "Description" box is disabled so that you can not type in it. When searching after filename it will search after the not compiled files and not the compiled files. Below those are two other boxes with two checkboxes. The boxes are labeled "From" and "To" and contain dates that can be changed by pressing the calender next to the box. The files are filtered so only files between those two dates are shown. The checkboxes are labeled "Measurement Date" and "Upload to Portal" and only one of them can be checked. The checkboxes tell if the files will be filtered by measurement or upload date. There is also a checkbox labeled "Hide downloaded files" which will filter out already downloaded files but this button is disabled if the checkbox "Compline by portal update date" is checked. These tools are the same for all type of assignments and can be seen as marked green in figure x.
GPX inclusion
The checkbox "Include GPX" enables gpx files to be downloaded when downloading result files. That means each downloaded result file will have a corresponding gpx file containing the route of the car when the assignment was executed. Note that the en date for the route is 24 hours after the start since assignments does not always have end dates. ETAS, Softhub, SignalReader and MCD-Hub assignments has this tool and its marked pink in figure x.
File type filters
There are three areas of checkboxes that are framed by a blue line and a sqaure checkbox labeled "Raw". The areas and the checkbox filter what type of files are shown. The framed areas stand for one filetype with their own subgroups. The areas are labeled with what file type they filter. When the square checkbox in the framed area is checked it will show you that areas file type. When their square checkbox is not checked the other checkboxes are disabled as they are the subgroups for that file type. The "Raw" checkbox is simpler as it only stands for if you want to show raw files and lacks subgroups. As with the other search functions in the WICE portal leaving all filters empty will result in everything being shown. The area labeled "Text" has 3 other checkboxes which will show you "Common", "Separate" and "All" text files. Note that not all text files have the subtype "Common" or "Seprate" and can only be shown in "All". The area labeled "MDF" has two other checkboxes which will you mdf files "With module names" or "Without module names" as a prefix for the signalnames. The area labeled "Vector" has two other checkboxes which will show you files refering to frames by "Frame ID" or "Frame name". MCD-Hub, Softhub and SignalReader have these tools but do not that Signalreader does not have the "Raw" button and can show all text files. These tools are marked blue in figure x.
Compile by upload date
The checkbox "Compile by portal upload date" will compile result files in a conteporary zip file if they were uploaded at the same time. When the files are compiled alot of functions that usually works on result files works differently or does not work as the zip file does not really exist or that its more than one file. As mentioned before you can not search for the compiled file since it does not exist. But when searching with this option turned on the compiled file will show up if one or more of the files it contains match the search criteria. This tools is automatically turned on since you are often looking after a specifik upload. MCD-Hub, Softhub and SignalReader have this tool and it is marked yellow in figure x.
Handling result files
When you have selected the result file(s) you want different buttons will be active depending on the file. The buttons are above the column bar and its where you download, view and convert result files.
"Get file(s)", "Get all files" and "Get log files" will open a dialog to download selected files, all files or that dates log files. Note! This section's text needs to be updated!
"Save Headers" saves your current view of columns and files and saves it as default. This button has since been replaced by the two binoculars that are described in The Portal User View#The Search Fields Section. We therefore advice you to use the new and improved binoculars as save headers will be removed.
"Plot route" will open a map in your current window. In that map you can see up to 100 of the cars registered positions during the last 24 hours or the last 100 registered positions. For more information about this read The Portal User View#Plot Route Dialog.
"View log files" will view log files from the selected file´s date. When viewing log files you can read them by selecting a file and pressing "View file". There is also the option to "Get file(s)", "Save Headers", "Plot route" and "View file" who are all except "View file" described above. "View file" will open the log file in readable format in your current window. You can also filter logfiles like you filter result files by date, name and if they are downloaded or not.
"View file" will open the file in a readable format in you current window. If the file is compiled by upload date or not readable this button will not be enabled.
"Convert to text" will convert and download selected MDF file(s) to your computer. When doing this you will get a pop-up with the ability to add a description to your download. This is only availible for MDF files and this button can therefore only be found on assignments with MDF files.
"Preview data" will give you a data preview window where you can preview the selected file(s) data. "Preview data" has many functions and tools that will be explained one by one below refering to figure x which is a preview data window. One of the main functions is to view signals as grafs and se their route. To do so you need to select signal(s) from the file(s) you want. You select signals to the right where you see the list of signals. That list of signals is specifik for the selected file. You can change which file you want signals from in the box "file viewer" on the left. Note that the files to the left are the files you had selected when clicking "Preview data". The selected signals can then be seen in the bottom under the tab "Signal preview" where you will see a quick preview of how their graph looks. You can save the selected signals by pressing the Wi-Fi symbol with a plus on it. This function work much like the binoculars except that you can not set a standard view. Note that its not the signal that is saved but the signal name so when loading saved signals it will search for signal names that are exactly identical and not signals that measure the same thing. By dragging the previewed signal(s) to the "Master signal preview" in the middle you can see a more extended version of the signal graph. If you want to have a bigger "master signal preview" you can press its fullscreen button on the left or you can manually hide other areas you do not want to see by pressing the "H" on them. To go show the areas again you can press the "S" (where "H" used to be). "Master signal preview" also has 3 preview modes that you can select in the bottom left corner of the "Master signal preview" area. The preselected view is with one graph on the left and a map on the right where the signals' routes will be shown. You can also select so that instead of a map it will show a second plot or so it only shows one plot. There are always two plots even though you always can not see two plots. This means you can always use the button "Switch" to make the plots switch places. When there is two plots shown they just switch positions but when there is only one plot shown the shown plot (the left one) will switch with the hidden plot (the right one). To zoom in on grafs you drag between two points(not necessarily data points) on the graf and it will zoom in between those two points.To zoom out you press "Reset zoom" for L or R depening on which plot you want to zoom out. Notice that "Zoom out (R)" is only clickable when you show two plots and that is because even if there always are two plots you can only zoom out and clear shown plots.
When clicking on a point in the graph you will se where the car was for that given time value on the map.
You can see statistics for the plots and their signal(s) at the bottom under the tab "Statistics". Here you have a buttom for if you want to show the left or right plot. What being showed is the plots signal and x/y min/max, mean value, standard devation, total amount of data samples and shown amount of data samples for each signal. Note that the plot can only show 500 samples for each signal and therefore need to hide samples for bigger signals. The plot will always try to have an as even as possible space between the samples and if its showing a signal with 502 signals it will show 251 as it will give the best view even if its not showing as many samples as it could.
At the bottom you can also download a plot as a text file. Under the tab "Data export" you select which plot you want to download, select between which time values it should download, set a download description(optional) and then press text file to make the file ready for download.
The Results Section
The results are fetched when you press Enter or when you press the "Search" button to the right in the Search tab. In order to view a result you simply select the assignment in the table that you are interested in. Depending on the assignment different buttons will be enabled. If there are results available the “Get Result Files” button will be enabled. Multiple rows in the table can be selected by holding down the shift key in order to select a range of rows or by holding down the ctrl-key to select individual rows.
If you right-click an entry you will be presented with a pop-up with a range of possibilities. Firstly, all the functionality of the buttons above the search result table is there along with a few more that are related to getting information. There is also some context awareness of this pop-up. An example of that is if you right-click in the WCU column, the option of showing the WCU information will be visible. If you instead right-click “Car” column, showing the cars information is visible. The reason for this is to keep the number of options to a minimum in order not to clobber your view. The “Task ID” column has an extra entry saying “Get result files” that brings up a dialog to download result files for a task. An explanation of this functionality can be found at the end of Active Tasks Tab#General Tab Layout.
There is an option to save which columns you are interested in to see. By clicking on the button “Save headers” the currently shown columns are saved and restored when you log in the next time. Right-clicking in the header will bring up menu where you can among other things select which columns should be visible in the table of results. The order of the columns can also be change by simply dragging a column to a new position. When saving the set of columns, the order of them is also saved on the server. The drop down menu of the table header is in Illustration 16. The current table can be exported to an excel sheet by selecting “Export to excel”.
The Result Files and Logs Dialog
An assignment can generate in principle an infinite number of result files. To be able to work with the files, a search window will open when you press the “Get Result Files” button or the “Get Log Files” button. There is only a minor difference in that when you hit the “Get Log Files” button not all search terms are available. See Illustration 17 below.
At the top we have some information regarding the task such as the ID and description. Next is a field to hide the search field to make room for the table with the list of files. There are 4 different kinds of search criteria you use to filter out the result files you are interested in: the date, file name, the size of the file and the type of file. As you type your different criteria in the search fields, the “Available files:” entry reflects the number of files that would be listed if you hit the “Search Files” button. Depending on the type of assignment you will be presented with a potentially differing set of buttons and controls. In the illustration above an MCD-Hub assignment was selected. To choose the subtype for a file, use the radio buttons for each of the types MDF, Vector and Text. The subtype selection is only enabled if the corresponding file type is checked.
The check box “Compile by upload date” groups together all results from each result upload from the WCU. This is very useful as one upload can contain thousands of files and you are mostly interested in all of them to gather statistics or analyzing the result. When you are satisfied with your search criteria, hit the Search Files button to view the list of files. An example of such a list is in Illustration 18 below. To select a file, click the row with the file you are interested in and it will be selected. By holding the shift-key down when you click an entry, all entries between the previous click and this one will be selected. To select a set of individual files, hold down the ctrl-key while selecting entries. When you push the Get File(s) button, a save file dialog opens where you can save the zip-file with your selected files zipped together.
On the right you have a set or four buttons. The top one has already been described and is straight forward as it downloads result files to your computer. The next “Save header” saves which columns your are interested in seeing. The third button is used to get a plot of where the car has been during the collection of data for the selected file. If the data series is long, the last 24 hours are used to plot the route. The fourth button, “View file” is also only used for text files (and log files) which opens up a simple text area window where you can view the contents of the file. You can also double click a text file entry to view the contents of a file. The fifth button is only visible for MCD-Hub assignments and it is used to convert files in MDF format to text format. When you are done, just hit the Back button and the window will disappear.
From version 2.42 it is also possible to include gpx-files together with the downloaded result files by having the "Include gpx files" checkbox checked. Currently this is set by default.
For each included result file, there will be a corresponding gpx file with the same filename as the result file. The gpx file will contain the route when the assignment was executed. Note that not all assignments have an end date, so in this case, the end date is set to 24h from the start date.
Downloading Files
Depending on the number of files and sizes of the result files, it can take a considerable time to zip the files together before they are ready for download. Therefore, files are zipped and getting ready in the background on the server and when they are ready for download you will be notified with a toast message at the top next to the download dialog icon. The icon can be found in the tool strip at the top depicted in Illustration 19 below.
When you press the “Get files(s)” button you will have the option of adding a description to the download which you can later see in the “My downloads” dialog for identification. Here you can also choose to insert VIN and plate number in all downloaded files. You can read more about hit here: Filenames when downloading. It is optional and you don't have to do that.
The following toast will be shown when the preparation begins.
When the preparation is done and your files are ready for download, the following toast will be shown in conjunction with the download icon in the tool strip.
To see what preparations are ready for download, click the download icon in the tool strip, a dialog called “My Downloads” will open. If a download is being prepared, the progress bar in the column “Progress” will fill gradually fill with green until it is ready. If you are downloading a file, the progress bar Download progress will gradually fill with green until it is done. If you entered a description for your preparation, it will show in the column “Description”. To download a file click the icon with a down pointing arrow. You will be prompted for an optional name of the downloaded file. Whatever you type there will automatically get the file extension “.zip”. To close the dialog, click the cross in the upper right corner of the dialog.
My Downloads Dialog
Whether it's zipped result files or converted text files, downloading them to your local computer is done via this dialog. Each row in the table corresponds to a file to download.
When you have decided to download some result files, a zipping process starts at the server. This process can take quite some time if the result files are large. If you change your mind and decide that you are not interested in the files currently getting zipped, you can choose to interrupt the file zipping process. This is done via the "cancel" icon that appears to the right in the "My downloads" dialog. See Figure "Cancel Download Process" for an example.
You can also choose to cancel an ongoing download this way. If the file zipping process was cancelled, the background colour of this row till change to red. This means that the file can not be downloaded and the column "Status" will display the reason. An example of this can be seen in Figure "Download Cancelled".
When you have downloaded or cancelled a download, the record for this download will stay in "My downloads" for three days until they are automatically removed. If you want to clean remove them earlier, click the red "remove record" icon that appears to the right of each downloaded/cancelled download.
The New Results Panel
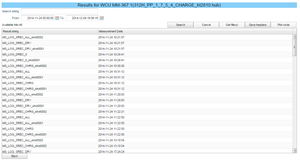
In an effort to somewhat abstract the notion that the MCD-Hub generates files, this panel has been introduced. You enter this panel by pressing the button “Use new panel” which you at the top as depicted in Illustration 17 in #The Result Files and Logs Dialog. In this panel you deal with meta data of a measurement. As an example, consider a measurement made using the assignment with the name “312H_PP_1_7_5_4_CHARGE_M2810.hub”. When the data is converted it is converted into a number of different formats, however some parts of the file name are consistent over the different formats. A result file from this assignment could be named “312H_PP_1_7_5_4_CHARGE_M2810_MS_LOG_SREC_DRV_shot0001_20141124_092157.dat”. Depending on file type it will end with .dat, .txt or .asc. In this panel the “set” of different files will be represented with only one entry namely “MS_LOG_SREC_DRV_shot0001” and a column with when the measurement was triggered. See Illustration 23 for an example. Here you can filter the result based on time and a string that matches part of the filename. Select the measurements you are interested in and press the “Get file(s)” button. You will now be presented with a selection window of which file types you are interested in. You can select as many file types as you which to download.
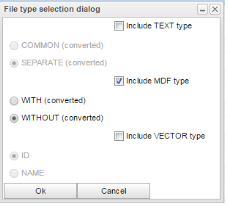
The file type selection dialog is as depicted in Illustration 24. In this dialog the MDF type of file is selected with the subtype without module names. After each subtype for the text and MDF type it says (converted). This means that this data is accessible right away with any need to convert the raw data into any of the formats, except for the Vector type which does not have the (converted) text for any of the subtypes. In case the file type you are interested in is not currently converted on the portal you will be given the option to start a conversion when you press the Ok button. Depending on the file type and amount of data in the measurement it can take a long time but when it is done you will get a message saying “Conversion done”.
Plot Route Dialog
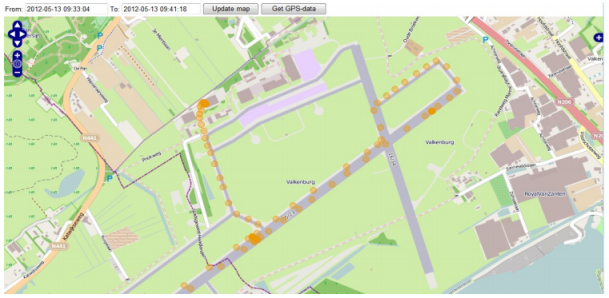
If you are interested in seeing where the car was driven while making measurements you can use the “Plot route” function by either using the button or the right-click menu. Doing this will open a dialog which by default plots the last 24 hour GPS positions (maximum of 100 positions) or, if there are not any during the last 24 hours, the last 100 registered positions. The dialog is depicted in Illustration 25 below. Just above the map are two dates present, from and to. These show the time interval that is shown on the map. You can change the dates and press the “Update map” button to view a new set a GPS positions during a measurement. You can zoom in and out of the map by pressing the plus or minus signs. By pressing the left mouse button and then drag the map you can freely move the map around. To zoom in on a particular area, hold down the left shift key and the left mouse button while dragging and a red rectangle will appear showing which area will be magnified. Release the mouse button to zoom in on the area. You can download the set of positions in a file by pressing the button “Get GPS-data”. This downloads the GPS data to your computer in the gpx format to be used elsewhere.
