Difference between revisions of "Plot Route"
| Line 1: | Line 1: | ||
==Plot Route Dialog== | ==Plot Route Dialog== | ||
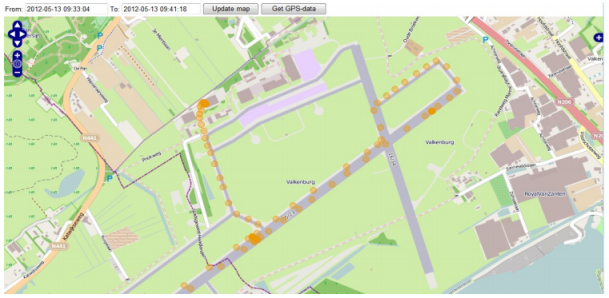
If you are interested in seeing where the car was driven while making measurements you can use the “Plot route” function by either using the corresponding button or right-click menu option. Doing this will open a dialog which by default plots the last 24 | If you are interested in seeing where the car was driven while making measurements you can use the “Plot route” function by either using the corresponding button or right-click menu option. Doing this will open a dialog which by default plots the last 24 hours' GPS positions (with a maximum of 100 positions) or, if there are not any during the last 24 hours, the last 100 registered positions. The dialog is depicted in Illustration 25 below. Just above the map are two date selections, labeled "From" and "To". These show the time interval that is shown on the map. You can change the dates and press the “Update map” button to view a new set of GPS positions during a specific measurement task. You can zoom in and out of the map by pressing the plus or minus signs. By pressing the left mouse button and then dragging the map you can freely move the map around. To zoom in on a particular area, hold down the left shift key and the left mouse button while dragging, whereupon a red rectangle will appear showing which map section will be magnified. Release the mouse button to zoom in on the area. You can download the set of positions in a file by pressing the button “Get GPS data”. This [[Downloading Files|downloads]] the GPS data to your computer in the gpx format.[[File:Illustration25.png|left|frame|Illustration 25: Plotting the route for a car during an assignment.|link=https://wiki.alkit.se/index.php/File:Illustration25.png]] | ||
Revision as of 16:11, 9 October 2017
Plot Route Dialog
If you are interested in seeing where the car was driven while making measurements you can use the “Plot route” function by either using the corresponding button or right-click menu option. Doing this will open a dialog which by default plots the last 24 hours' GPS positions (with a maximum of 100 positions) or, if there are not any during the last 24 hours, the last 100 registered positions. The dialog is depicted in Illustration 25 below. Just above the map are two date selections, labeled "From" and "To". These show the time interval that is shown on the map. You can change the dates and press the “Update map” button to view a new set of GPS positions during a specific measurement task. You can zoom in and out of the map by pressing the plus or minus signs. By pressing the left mouse button and then dragging the map you can freely move the map around. To zoom in on a particular area, hold down the left shift key and the left mouse button while dragging, whereupon a red rectangle will appear showing which map section will be magnified. Release the mouse button to zoom in on the area. You can download the set of positions in a file by pressing the button “Get GPS data”. This downloads the GPS data to your computer in the gpx format.
