Difference between revisions of "Monitor signals"
(Wrote about the new interface) |
|||
| Line 7: | Line 7: | ||
To monitor a WCU you first need to go to the [[Vehicles|Vehicles Panel]]. Search for and select all WCUs that you wish to monitor. Note that you from version 2.6 can select several WCUs at once. Once you are satisfied with your selection you can click the "Monitor signals" button at the bottom of the page. | To monitor a WCU you first need to go to the [[Vehicles|Vehicles Panel]]. Search for and select all WCUs that you wish to monitor. Note that you from version 2.6 can select several WCUs at once. Once you are satisfied with your selection you can click the "Monitor signals" button at the bottom of the page. | ||
Once the monitoring view is opened you should now be able to see all of the WCUs you selected on your left hand side of the screen. This is the ''''' | Once the monitoring view is opened you should now be able to see all of the WCUs you selected on your left hand side of the screen. This is the '''Source list''.''''' <span style="color:rgb(255,0,0)">Any source marked in red is a non-monitorable source.</span> | ||
=== Select signals === | === Select signals === | ||
Once you have | Once you have all your sources gathered in the Source list you can select any of these sources to get a list of all monitorable signals that are available for that specific source in the '''''Signal list''''' on your right hand side. You can select as many of these signals as you like. Once selected, a signal will show up in the '''signal preview''' at the bottom of the page. These previews allows you to get a quick overview of all selected signals in order to see if any of them are receiving any new data. If they are, then that data will be plotted within the preview. | ||
If you want to study any set of signals in detail you can simply <u>drag and drop</u> them onto any of the plot canvases inside the '''Master signal preview'''. Doing so also plots their current positions on the map. | |||
=== Clean map from lines === | === Clean map from lines === | ||
If the map at some point gets too cluttered you have the option to "clean" the map. This is done by clicking the "Map options"-tab in the dashboard, followed by clicking the "clean" button found in the "controls" section. | If the map at some point gets too cluttered you have the option to "clean" the map. This is done by clicking the "Map options"-tab in the dashboard, followed by clicking the "clean" button found in the "controls" section. | ||
== | === Exit the signal preview === | ||
To exit the signal preview you simply click the "back"-button at the very bottom of the screen. | |||
Revision as of 12:34, 11 January 2018
Monitor signals allows you to monitor signal values and WCU position in real time.
This view is very similar to the view when plotting MDF signals.
Select one or several WCUs
To monitor a WCU you first need to go to the Vehicles Panel. Search for and select all WCUs that you wish to monitor. Note that you from version 2.6 can select several WCUs at once. Once you are satisfied with your selection you can click the "Monitor signals" button at the bottom of the page.
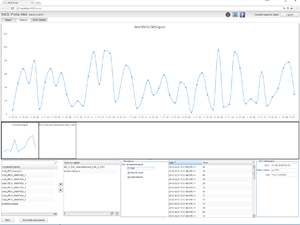
Once the monitoring view is opened you should now be able to see all of the WCUs you selected on your left hand side of the screen. This is the Source list. Any source marked in red is a non-monitorable source.
Select signals
Once you have all your sources gathered in the Source list you can select any of these sources to get a list of all monitorable signals that are available for that specific source in the Signal list on your right hand side. You can select as many of these signals as you like. Once selected, a signal will show up in the signal preview at the bottom of the page. These previews allows you to get a quick overview of all selected signals in order to see if any of them are receiving any new data. If they are, then that data will be plotted within the preview.
If you want to study any set of signals in detail you can simply drag and drop them onto any of the plot canvases inside the Master signal preview. Doing so also plots their current positions on the map.
Clean map from lines
If the map at some point gets too cluttered you have the option to "clean" the map. This is done by clicking the "Map options"-tab in the dashboard, followed by clicking the "clean" button found in the "controls" section.
Exit the signal preview
To exit the signal preview you simply click the "back"-button at the very bottom of the screen.
