Difference between revisions of "Plot MDF signals"
Alkitjohan (talk | contribs) |
|||
| (6 intermediate revisions by 2 users not shown) | |||
| Line 1: | Line 1: | ||
From 2.43 of the WICE portal a new panel is in place for plotting MDF signals. | From 2.43 of the WICE portal a new panel is in place for plotting MDF signals. | ||
[[File:Plot mdf signals1.png| | |||
To access the panel, go to the | [[File:Plot mdf signals1.png|500px|thumb|Preview Data Panel]] | ||
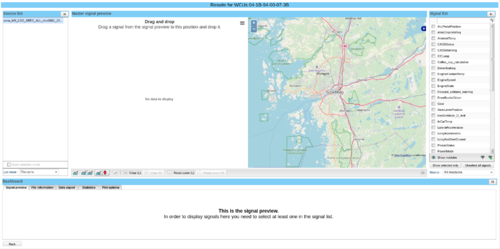
To access the panel, go to the Task Tab, select a task and press the "Get Result Files"-button. In this view deselect the "Compile by portal upload date" checkbox so that each generated mdf-file is listed individually. Then either select a file and click the "Preview data" button or double click the filename. This will take you to the view illustrated in Figure "Preview Data Panel". | |||
=== Select signals to plot === | |||
The available signals for the selected file are listed in the the "Signal list", marked to the right in Figure "Plot Selected Signals". When a signal is selected it is shown in the bottom "Dashboard"-section under the "Signal preview"-tab. To deselect a signal, either uncheck the corresponding checkbox or close down its window in the "Signal preview"-tab. | |||
=== Plot selected signals === | |||
[[File:Plot mdf signals2.png|500px|thumb|Plot Selected Signals]] | |||
To display a signal in the "Master signal preview", either double click on the signal in the "Dashboard"-section or drag-and-drop it to the target location. Signals can be compared either by dragging-and-dropping them to the same graph or by plotting them in graphs next to each other, both of which can be seen in Figure "Plot Selected Signals". To obtain the view with side-by-side graphs, change the layout with buttons marked out in the bottom of the "Master signal preview"-section. | |||
=== File information === | |||
Information from the chosen MDF file is displayed in the "File information"-tab in the "Dashboard"-section, see Figure "Plot Selected Signals". | |||
=== Data export === | |||
In the "Dashboard"-section, it is also possible to export the data of the selected signals in the "Data export"-tab. | |||
=== Statistics === | |||
Under the "Statistics"-tab in the "Dashboard"-section you find a table with values of statistical parameters for each signal. Note that there are separate tables for the right and left graph data. | |||
=== Plot options === | |||
Plot options for the graphs can be changed in the "Plot options"-tab in the "Dashboard"-section, see Figure "Plot Selected Signals". | |||
Latest revision as of 13:34, 4 April 2019
From 2.43 of the WICE portal a new panel is in place for plotting MDF signals.
To access the panel, go to the Task Tab, select a task and press the "Get Result Files"-button. In this view deselect the "Compile by portal upload date" checkbox so that each generated mdf-file is listed individually. Then either select a file and click the "Preview data" button or double click the filename. This will take you to the view illustrated in Figure "Preview Data Panel".
Select signals to plot
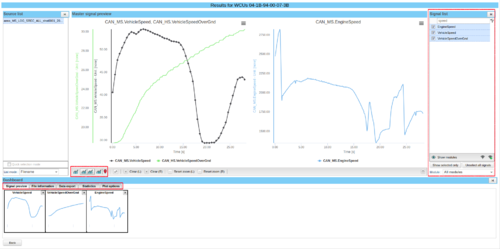
The available signals for the selected file are listed in the the "Signal list", marked to the right in Figure "Plot Selected Signals". When a signal is selected it is shown in the bottom "Dashboard"-section under the "Signal preview"-tab. To deselect a signal, either uncheck the corresponding checkbox or close down its window in the "Signal preview"-tab.
Plot selected signals
To display a signal in the "Master signal preview", either double click on the signal in the "Dashboard"-section or drag-and-drop it to the target location. Signals can be compared either by dragging-and-dropping them to the same graph or by plotting them in graphs next to each other, both of which can be seen in Figure "Plot Selected Signals". To obtain the view with side-by-side graphs, change the layout with buttons marked out in the bottom of the "Master signal preview"-section.
File information
Information from the chosen MDF file is displayed in the "File information"-tab in the "Dashboard"-section, see Figure "Plot Selected Signals".
Data export
In the "Dashboard"-section, it is also possible to export the data of the selected signals in the "Data export"-tab.
Statistics
Under the "Statistics"-tab in the "Dashboard"-section you find a table with values of statistical parameters for each signal. Note that there are separate tables for the right and left graph data.
Plot options
Plot options for the graphs can be changed in the "Plot options"-tab in the "Dashboard"-section, see Figure "Plot Selected Signals".

