Difference between revisions of "Monitor signals"
Alkitjohan (talk | contribs) (Created page with "thumb|Monitor signals 1 From version 2.43 of the portal the WCU monitoring for signal reader assignments is now using a graph to plot instead of...") |
Alkitjohan (talk | contribs) |
||
| Line 5: | Line 5: | ||
This view is very similar to the view when [[Plot MDF signals|plotting MDF signals]]. | This view is very similar to the view when [[Plot MDF signals|plotting MDF signals]]. | ||
=== Select signals to plot === | |||
The available signals for the selected file are listed in the "Unselected signals" box in the lower left corner of the view. To select a signal for plotting, you can either double click the signal name, drag it to "Selected signals" box or use the arrow buttons between the boxes. | |||
=== Plot selected signals === | |||
[[File:Plot mdf signals2.png|thumb|Plot MDF Signals 2]] | |||
When one or more signals are added to "Selected signals" a thumbnail of each signal plot is added to the box above the "Unselected and selected signals" boxes. See illustration Plot MDF signals 2. | |||
To view the plot in full screen, simply click the thumbnail. | |||
=== Plot options === | |||
To the right of "Selected signals" it is possible to adjust the currently selected plot by adding/removing a background grid, make the curve appear smoother and display markers for each single data point in the plot. | |||
It is also possible to enlarge or shrink the plot thumbnail size. | |||
=== Data === | |||
The data displayed in the currently selected plot is also available as a table. | |||
=== MDF file information === | |||
Information from the chosen MDF file is displayed in the "MDF file information" box to the right of the Data table. | |||
Revision as of 15:59, 21 December 2016
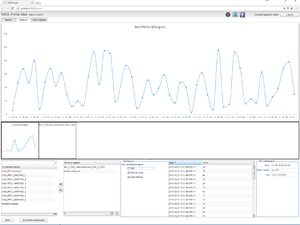
From version 2.43 of the portal the WCU monitoring for signal reader assignments is now using a graph to plot instead of showing the signals in a table.
To monitor signals for a WCU that is running a signal reader assignment, select the WCU in the Vehicles view and click the button "Monitor signals". This will take you to the view as shown in illustration "Monitor signals 1".
This view is very similar to the view when plotting MDF signals.
Select signals to plot
The available signals for the selected file are listed in the "Unselected signals" box in the lower left corner of the view. To select a signal for plotting, you can either double click the signal name, drag it to "Selected signals" box or use the arrow buttons between the boxes.
Plot selected signals
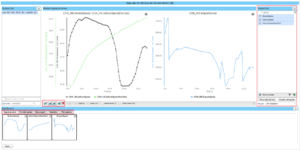
When one or more signals are added to "Selected signals" a thumbnail of each signal plot is added to the box above the "Unselected and selected signals" boxes. See illustration Plot MDF signals 2.
To view the plot in full screen, simply click the thumbnail.
Plot options
To the right of "Selected signals" it is possible to adjust the currently selected plot by adding/removing a background grid, make the curve appear smoother and display markers for each single data point in the plot.
It is also possible to enlarge or shrink the plot thumbnail size.
Data
The data displayed in the currently selected plot is also available as a table.
MDF file information
Information from the chosen MDF file is displayed in the "MDF file information" box to the right of the Data table.

