Difference between revisions of "Preview data"
Alkitjohan (talk | contribs) |
Alkitjohan (talk | contribs) |
||
| Line 8: | Line 8: | ||
# In order to inspect a signal more closely, double click or "drag and drop" the signal into the Master signal preview. | # In order to inspect a signal more closely, double click or "drag and drop" the signal into the Master signal preview. | ||
# If there is any GPS data available, then that data will be visualized in the map. | # If there is any GPS data available, then that data will be visualized in the map. | ||
# If there is any video data available, then one or more blue fields labelled "video" will be visible in the plot window. To access the video, click on the blue field. '''From version 2.57, this has changed. See [[Preview data#Integrated video and audio]]''' | # If there is any video data available, then one or more blue fields labelled "video" will be visible in the plot window. To access the video, click on the blue field. '''From version 2.57, this has changed. See [[Preview data#Integrated video and audio preview|Preview data#Integrated video and audio]]''' | ||
== Integrated video and audio preview == | == Integrated video and audio preview == | ||
Revision as of 16:01, 28 February 2020
This is a tool used to graph signal values from MDF-files, preview Video and visualize GPS-data.
How to use
- Select a "Source" (file or measurement) from the source list on the left hand side of the screen
- A list of signals will show up in the signal list on the right hand side of the screen. Select one or more.
- Each selected signal will show up as a thumbnail at the bottom of the screen
- In order to inspect a signal more closely, double click or "drag and drop" the signal into the Master signal preview.
- If there is any GPS data available, then that data will be visualized in the map.
- If there is any video data available, then one or more blue fields labelled "video" will be visible in the plot window. To access the video, click on the blue field. From version 2.57, this has changed. See Preview data#Integrated video and audio
Integrated video and audio preview
To see what videos are available a signal needs to be selected and inserted into the master signal preview.
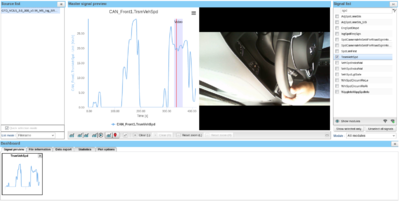
The preview tool will automatically detect if there is any video correlated to the currently selected file. If such video exists, then a blue field will show up in the plot that is labelled "Video". Such a field is visible in the Figure called "The Preview Data Window -Video", which has integrated video support.. If you want to preview that video, simply click on the blue field. The video view will open, and the video will start playing. You can also click on the plot line inside of the video field to jump to an exact timestamp in the video. This means that if you wish to see what happened in the video when a certain signal peak occurred then you can click on that peak and the video will instantly jump to the correct timestamp.
The following affects portal version 2.57 and above:
From version 2.57 the video field has been moved to a new chart (the media controller chart) below the main plot. This charts show all video and audio measurements for the current selected measurement. If no such measurements exists for the selected measurement, the media controller chart is not visible.
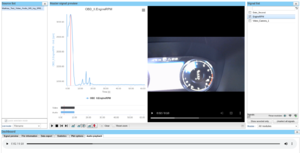
An example of a measurement with both audio and video measurements can be seen in Preview Data Window - Video and Audio.
Control playback of audio and video measurements
There are several ways of controlling the playback for the found media measurements. By default the playback starts from time = 0 when the user clicks the play icon in toolstrip below the media chart. If there is any media file at the current position (as in the example) the playback of the measurements is automatically started. One can also choose to start from a certain position by either clicking between the audio and video bars in the chart or by ctrl+left mouse click on the plot in the main chart.
When the playback is started, the red marker is moving in the two grids and the play button is replaced by the pause button. Simply click the pause button to pause the playback.
To stop and revert the playback to the start position, click the stop button. The left and right buttons to the right of the stop buttons are used to jump to the nearest media measurement on the timeline.
The playback of the video and/or audio file can also be individually controlled via the integrated controllers in the respective windows.
If both audio and video measurements exists (like in the example) one can choose to only play the video measurement by clicking the video measurement bar in the graph.
Integrated GPS data visualization
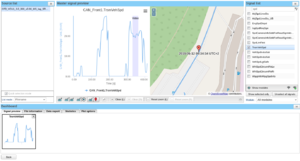
By default the map will be set to display a plot, along side of a map. Once a signal is selected and pushed up into the mater signal preview any available GPS data will be visualized in the map, see Figure "Preview Data Window - GPS". If you click on the plot line a marker will be placed in the map which indicates where the car was at that point in time.
Y-axis scaling
By default the vertical axis is scaled based on a signals predetermined minimum and maximum values which are embedded into the MDF file. This has two advantages. Primarily it makes the same signal from two different measurements easier to compare, but it should also help display the signal using a scale that is relevant for that particular signal. There are however a set of circumstances in which this principle is abandoned in favor of auto fit:
- If the signal has no default min/max values
- If the signals min value is greater than its max value
- If the actual signal is outside of the predetermined min/max bounds.
- If the predetermined max is a lot higher than the actual max of the signal. This is to prevent the previewed signal from being displayed as nothing but a flat line at the bottom of the graph.
If any of these conditions are true, then the vertical min/max will be automatically fitted to the curve based on the curves extreme values.
Plot toolbar
Preview modes
"Master signal preview" has four different preview modes which you can select from the bottom left corner of the "Master signal preview" window:
- View only one plot
- View two plots side by side
- View a plot, and video side by side
- View a plot and GPS data visualization side by side (this is the default view)
Window size
If you want to have a bigger "Master signal preview" you can press the fullscreen button on the bottom right of the Master signal preview window, or you can manually hide other areas you do not wish to see by pressing the "H" on them. To show the areas again you can press the "S".
Switching between plots
There are always two plots even though there might only be one shown. This means you can always use the button "Switch" to make the plots switch places. When there are two plots shown they switch positions but when there is only one plot shown the shown plot (the left one) will switch with the hidden plot (the right one). This can be useful when comparing signals.
Zooming
To zoom in on graphs you drag between two points(not necessarily data points) on the graf and it will zoom in between those two points.To zoom out you press "Reset zoom" for L or R depending on which plot you want to zoom out. Notice that "Zoom out (R)" is only clickable when you show two plots and that is because even if there always are two plots you can only zoom out and clear shown plots.
Statistics
You can see statistics for the plots and their signal(s) at the bottom under the tab "Statistics". To the left you have a button for if you want to show the left or right plot. What being showed is the plots signal and x/y min/max, mean value, standard devation, total amount of data samples and shown amount of data samples for each signal. Note that the plot can only show 500 samples for each signal and therefore need to hide samples for bigger signals. The plot will always try to have an as even as possible space between the samples and if it is showing a signal with 502 signals it will show 251 as it will give the smoothest and most accurate view even if its not showing as many samples as it could.
Other features
Export options
At the bottom you can also download a plot as a text file. Under the tab "Data export" you select which plot you want to download, select between which time values it should download data points, set a download description (optional) and then press "To text file" to make the file ready for download. The text file you download is supported in Excel.
Saving signals
You can save the currently selected signals by pressing the signal symbol with a plus on it located on the bottom right of the "Signal List". This allows you to reload these signals in any source as long as that source contains signals with exactly matching names.
Quick selection mode
This selection mode allows you preview the same set of signals from an array of files with ease. Here is how it works:
- This requires you to have selected two or more files before you entered the signal preview interface.
- Beneath the source list to the left you will find a checkbox that says "Quick selection mode". Click it.
- Select a file by clicking on a file in the source list.
- Select any number of signals in the signal list.
- If you want to add any of the signals into the master preview, then do so by dragging and dropping (or double clicking) the thumbnails as usual.
- You can now swap between files by selecting any file you like from the source list. When you swap file the signals you selected previously will now be selected again in the new file.
Notice: This will only work if both files have signals with the exact same name. Any deviation in signal naming will cause the program to be unable to find the signal, thus skipping it and moving on to the next signal


