Difference between revisions of "Plot Route"
(Created page with "==Plot Route Dialog== If you are interested in seeing where the car was driven while making measurements you can use the “Plot route” function by either using the button o...") |
(Added generic information about plot route, and an image of a measurement) |
||
| (11 intermediate revisions by 4 users not shown) | |||
| Line 1: | Line 1: | ||
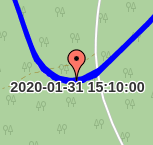
== | [[File:Plot-route-measure.png|thumb|Signal reader measurement visible in the map. Can be clicked to review the data available from that measurement.]] | ||
If you are interested in seeing where the car was driven while making measurements you can use the “Plot route” | Plot route is a tool that enables plotting the GPS-coordinates of a resource from a specific time interval. Additionally, signal reader measurements are marked out on the map where they occurred. The user can click on these markers to immediately access the [[Preview data|Preview data tool]] where the clicked measurement can be examined in detail. | ||
==How to access this tool== | |||
If you are interested in seeing where the car was driven while making measurements you can use the “Plot route” tool. This tool can be accessed either by selecting and then right-clicking a task in the tasks panel. You can also access the tool from the bottom menu in both the tasks and vehicles panel. | |||
== How it works == | |||
An important detail to note is that plot route is a tool that operates using the data of a specific car. The tool will check which car you have selected. It will then aggregate the GPS-data of all the WCUs that has been installed in the car during the specified time period. This is the data that is plotted. | |||
== Sidebar controls == | |||
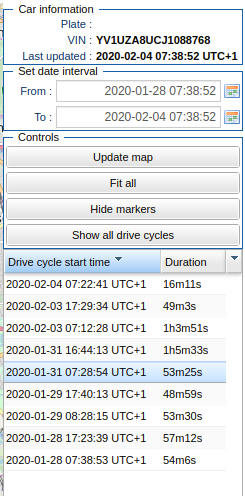
[[File:Plot-route-20200204.png|frame|Plot route controls]] | |||
On the right sight of the screen there is a set of controls available to the user to navigate through the route data available for the selected resource. | |||
=== Car information === | |||
The "Car Information" panel displays the plate number, VIN and when the latest known GPS update occurred for the selected resource. | |||
=== Set date interval === | |||
The "Set date interval"-form can be used to select an interval within which you wish you know where the resource has been. '''This interval has a maximum length of one month''', and is by default set to the last known GPS update date. If you wish to change the interval, simply enter the date interval of your choice and click "update map". | |||
=== Controls === | |||
If you are having any trouble locating the data in the map you can utilize the "'''Fit all'''"-button. This button ensures that all position data is visible on the map by zooming out and panning to an appropriate location. | |||
Also in the controls panel is the option to hide/show measurement markers. | |||
=== Drive cycle list === | |||
The drive cycle list provides a way to preview individual drive cycles. By '''clicking on a row''' in the list all drive cycles on the map are hidden except for the one that is selected. Additionally it is possible to '''double click on a row''' which not only displays the selected drive cycle, but also pans the map view and zooms in so that the drive cycle can be seen clearly. If at any point you wish to see all drive cycles in the view again you can click the "'''Show all drive cycles'''"-button, which will return the map to its initial state. | |||
== Visualization of drive cycles and signal reader measurements == | |||
=== Drive cycles === | |||
If the plot route tool detects that there was a significant time difference between two reported positions, then it will assume that they are part of different "drive cycles". This is visualized in the map by giving different drive cycles different colors. However, after a certain threshold too many drive cycles will result in the colors repeating, thus giving some data series the same color. | |||
=== Signal reader measurements === | |||
Measurements are visualized on the map using markers. These markers are positioned where the measurement started. You can click the measurement markers to jump straight to the [[Preview data|preview tool]] where you can preview signal data from that specific measurement. | |||
Latest revision as of 14:34, 4 February 2020
Plot route is a tool that enables plotting the GPS-coordinates of a resource from a specific time interval. Additionally, signal reader measurements are marked out on the map where they occurred. The user can click on these markers to immediately access the Preview data tool where the clicked measurement can be examined in detail.
How to access this tool
If you are interested in seeing where the car was driven while making measurements you can use the “Plot route” tool. This tool can be accessed either by selecting and then right-clicking a task in the tasks panel. You can also access the tool from the bottom menu in both the tasks and vehicles panel.
How it works
An important detail to note is that plot route is a tool that operates using the data of a specific car. The tool will check which car you have selected. It will then aggregate the GPS-data of all the WCUs that has been installed in the car during the specified time period. This is the data that is plotted.
Sidebar controls
On the right sight of the screen there is a set of controls available to the user to navigate through the route data available for the selected resource.
Car information
The "Car Information" panel displays the plate number, VIN and when the latest known GPS update occurred for the selected resource.
Set date interval
The "Set date interval"-form can be used to select an interval within which you wish you know where the resource has been. This interval has a maximum length of one month, and is by default set to the last known GPS update date. If you wish to change the interval, simply enter the date interval of your choice and click "update map".
Controls
If you are having any trouble locating the data in the map you can utilize the "Fit all"-button. This button ensures that all position data is visible on the map by zooming out and panning to an appropriate location.
Also in the controls panel is the option to hide/show measurement markers.
Drive cycle list
The drive cycle list provides a way to preview individual drive cycles. By clicking on a row in the list all drive cycles on the map are hidden except for the one that is selected. Additionally it is possible to double click on a row which not only displays the selected drive cycle, but also pans the map view and zooms in so that the drive cycle can be seen clearly. If at any point you wish to see all drive cycles in the view again you can click the "Show all drive cycles"-button, which will return the map to its initial state.
Visualization of drive cycles and signal reader measurements
Drive cycles
If the plot route tool detects that there was a significant time difference between two reported positions, then it will assume that they are part of different "drive cycles". This is visualized in the map by giving different drive cycles different colors. However, after a certain threshold too many drive cycles will result in the colors repeating, thus giving some data series the same color.
Signal reader measurements
Measurements are visualized on the map using markers. These markers are positioned where the measurement started. You can click the measurement markers to jump straight to the preview tool where you can preview signal data from that specific measurement.

