Difference between revisions of "Key Figures"
Jump to navigation
Jump to search
| Line 1: | Line 1: | ||
From version 2.51 the concept of key figures has been introduced in the WICE portal.[[File:Keyfigures tab.png|thumb|Key Figures tab]]Statistical key figures regarding regarding resource creation and data upload is graphically presented in the Key Figures Tab found under the [[The Portal Administrator View#The Administration Tab|Administration Tab]], see Figure "Key Figures tab". To the right there is a hidable panel used for WCU selection for the WCU specific statistics and to the left there is another hidable panel which is used to view/hide the available statistical charts. | From version 2.51 the concept of key figures has been introduced in the WICE portal.[[File:Keyfigures tab.png|thumb|Key Figures tab]]Statistical key figures regarding regarding resource creation and data upload is graphically presented in the Key Figures Tab found under the [[The Portal Administrator View#The Administration Tab|Administration Tab]], see Figure "Key Figures tab". To the right there is a hidable panel used for WCU selection for the WCU specific statistics and to the left there is another hidable panel which is used to view/hide the available statistical charts. | ||
[[File:Keyfigures chart 1.png|thumb|Key figures chart 1]] | |||
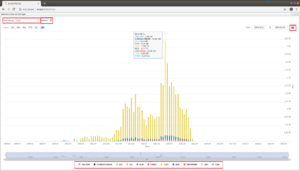
The statistics are presented in stacked column charts, examples of which can be seen i in Figures "Key Figure Chart 1" and "Key Figure Chart 2". | |||
Revision as of 10:19, 19 December 2018
From version 2.51 the concept of key figures has been introduced in the WICE portal.
File:Keyfigures tab.png
Key Figures tab
Statistical key figures regarding regarding resource creation and data upload is graphically presented in the Key Figures Tab found under the Administration Tab, see Figure "Key Figures tab". To the right there is a hidable panel used for WCU selection for the WCU specific statistics and to the left there is another hidable panel which is used to view/hide the available statistical charts.
The statistics are presented in stacked column charts, examples of which can be seen i in Figures "Key Figure Chart 1" and "Key Figure Chart 2".
