Preview data
This is a tool used to graph signal values from MDF-files, preview Video and visualize GPS-data.
Quick usage guide
Here is a step by step guide walking you through a simple use case to get you started. For more detailed info on the different settings or function read the article below.
- Select a "Source" (file or measurement) from the source list on the left hand side of the screen.
- A list of signals will show up in the signal list on the right hand side of the screen. Select one or more.
- Each selected signal will show up as a thumbnail at the bottom of the screen.
- In order to inspect a signal more closely, double click or "drag and drop" the signal into the Master signal preview to plot it.
- If there is any GPS data available, then that data will be visualized in the map.
- If there is any video or audio data available, then a media controller is visible below the main plot. See Preview data#Integrated video and audio
Source List
The source list is a list of all source files that have been added to the signal preview. Here you chose which file you want to view signals from by clicking on it and when switching between sources they will try to keep selections as similar as possible. This means that if 2 sources share signals and you select and plot a shared signal in one source and then switch to the other the signal will stay selected and plotted.
At the bottom of the source list you can switch between showing the sources as their filenames or as their measurement dates.
Adding/removing source files without loosing setting and selections
At the bottom left of the screen you can press the button "Add more files" to add new files and remove current files without removing your settings or which signals are selected. By pressing this button the tasks panel will re-open but with a second list of files at the bottom which shows the selected files in the preview.
To add new files you search for the file you want to add and drag it from the top box to the bottom box where it will now appear.
To remove a file you drag it from the bottom box to the top box which makes the file disappear in the bottom box.
When you are done adding and removing files you press the button "Add Files to preview" at the right side of the screen to get back to the preview with the files from the bottom box.
Signal List
From the signal list you select which signals you want to view from the selected source. To help you find which signals you want to view there is a search bar at the top of the list. You can also at the bottom of the list select to see signals from a specific module.
Save signal selection
If you want to save a set of selected signals for suture use you start by selecting the signals you want to save and then pressing the "Save selection" button on the bottom of the signal list. This will open a small window where you first need to enter a name and then press "Save collection" to save your selected signals.
Apply saved signal selection
To apply a saved set of selected signals you will press the "Apply signals" button which opens a small window. Here you will see all saved sets and you can apply one by selecting the one you want to apply and click "Apply collection". Note that this will only select and not deselect signals so if you only want to have the signals in the set selected you first need to make sure that no signals are selected (which can be done with the "Unselect all signals" button).
Show/Hide module prefix
If you want to have the module name as a prefix to the signal name you can enable that by pressing the "Show modules button" and you can also disable it by pressing the "Hide modules" button. Note that this also affects the signal names in the dashboards signal preview.
Dashboard
In the Dashboard you find multiple tabs with different functions and purposes which you can read about below.
Signal preview
The Signal preview tab shows you a small preview of all selected signals in the signal list tab. By double clicking on or dragging a preview into the master preview you will plot the signal. Here you can also deselect (and in that way stop a signal from being plotted by pressing the "x" on the preview.
File information
Here you will find information about the selected source file.
Data export
Here you can export the data from the plotted signals as a text file. To do this select the signals you want to plot in the left most box, specify what interval you want data from, set a download description and then press "To text file".
Statistics
Here you find statistics like amount of data points, mean and global max about the plotted signals.
Plot Options
Here you can set how the Y-axes of the signals should behave. By default its set to "Fit to curve" meaning all signals will be fitted to the curve making the signals max value the highest point and the signals min value as the signals lowest point. The other option "Signal default" makes the vertical axis be scaled based on a signals predetermined minimum and maximum values which are embedded into the MDF file. Which makes it easier to compare the same signal from different measurements and possible shows the signal in a more appropriate scale.
Audio Playback
When plotting a signal with accompanying video and audio you can use this panel to control the audio being played.
Master Preview
Preview Modes
"Master signal preview" has four different preview modes which you can select from the bottom left corner of the "Master signal preview" window:
- View only one plot
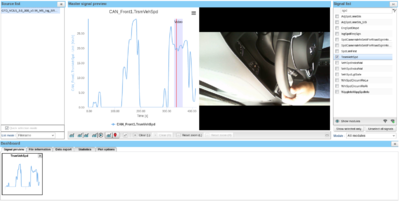
- View a plot, and video side by side
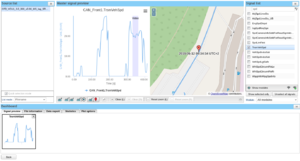
- View a plot and GPS data visualization side by side (this is the default view)
Integrated video and audio preview
If video mode is selected then the preview tool will automatically detect if there is any video correlated to the currently selected file. If such video exists, a media controller chart will be visible below the main play. See screenshot "Preview Data Window - Video".
There are several ways of controlling the playback for the found media measurements. By default the playback starts from time = 0 when the user clicks the play icon in toolstrip below the media chart. If there is any media file at the current position (as in the example) the playback of the measurements is automatically started. One can also choose to start from a certain position by either clicking between the audio and video bars in the chart or by ctrl+left mouse click on the plot in the main chart.
When the playback is started, the red marker is moving in the two grids and the play button is replaced by the pause button. Simply click the pause button to pause the playback.
To stop and revert the playback to the start position, click the stop button. The left and right buttons to the right of the stop buttons are used to jump to the nearest media measurement on the timeline.
If both audio and video measurements exists (like in the example) one can choose to only play the video measurement by clicking the video measurement bar in the graph. This also applies to when there are multiple overlapping videos.
If there are multiple overlapping videos, on of the videos can be viewed in "picture in picture-mode". To enable this, click the three dots in the bottom right corner of the video and select "Picture in picture" in the sub menu appearing.
This can of course also be used for a single video as well.
Integrated GPS data visualization
By default the map will be set to display a plot, along side of a map. Once a signal is selected and pushed up into the mater signal preview any available GPS data will be visualized in the map, see Figure "Preview Data Window - GPS". If you click on the plot line a marker will be placed in the map which indicates where the car was at that point in time.
When right clicking on the plot there appears a context menu where you can control settings of the plot which are described below. An important thing to note is that even when an element of the plot is hidden you can still change it even though you will not see the change until the element is revealed again.
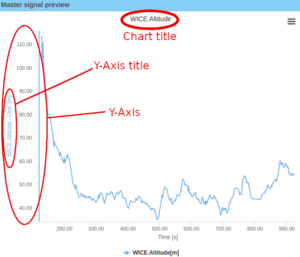
Set title
With the "Set filename/signalnames as title" button you can switch between having the signals names as the title of the plot or having the filename as the plot title.
Hide/show title
By pressing the "Hide/Show chart title" button you will either make the title disappear or reappear.
Hide/show Y-Axes titles
By pressing the "Hide/Show yaxis titles" button the titles on the all the yaxes will disappear or reappear.
Hide/Show Y-Axes
With the "Hide/Show YAxes" button you will make all the YAxes disappear or reappear (including the axis titles).


